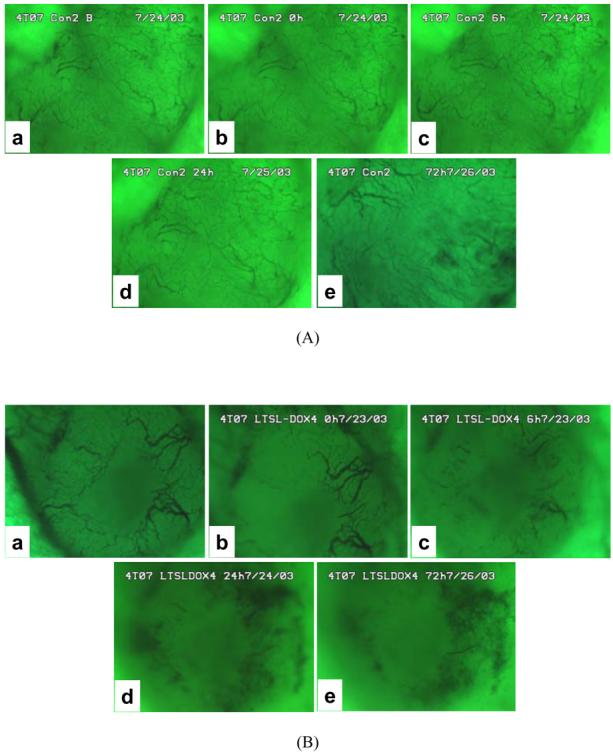
Figure 3.

Typical images of tumor surfaces in (A) control and (B) LTSL-DOX-HT treated groups. In each group, the images show the network of tumor vasculature at (a) 0.5 hr before treatment, and at (b) 0 hr, (c) 6 hrs, (d) 24 hrs, and (e) 72 hrs after treatment.
