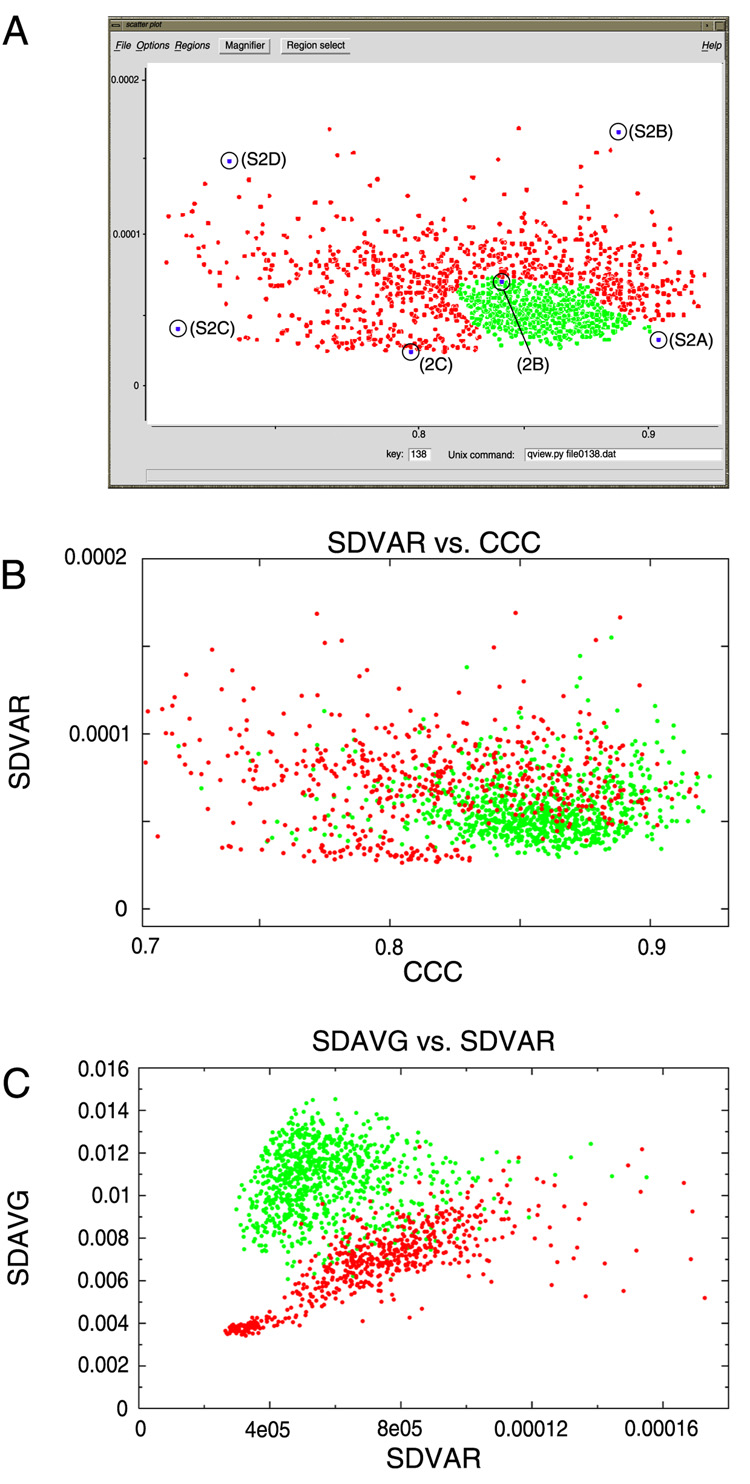
Figure 3.
Scatter plot examples. (A) x-axis is cross-correlation coefficient (CCC). y-axis is standard deviation of the class variance (SDVAR). Selected classes are displayed in green. The boundary between retained and excluded classes was determined by clicking on selected points and opening the montage of individual particles. Labels for circled points refer to the figure for the corresponding montage of particles, e.g., (S2D) for Supplementary Figure 2D. (B) Comparison of the retained classes as selected by the “whole classes” mode. (C) Same classes as in B redisplayed, with the SDVAR as abscissa and the standard deviation of the average (SDAVG) as ordinate.

