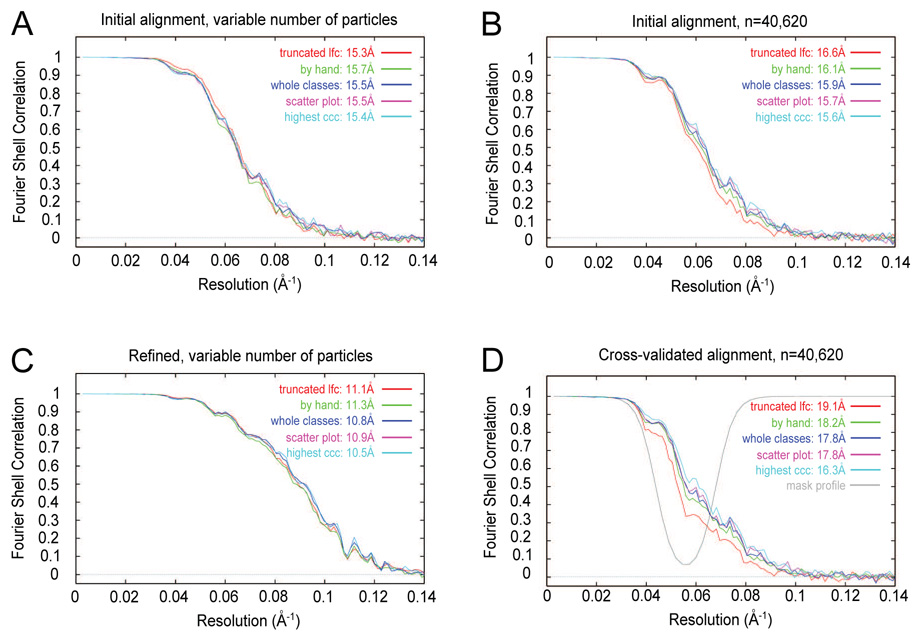
Figure 5.
Fourier shell correlation curves for various particle-verification modes. Following the name of each particle set is the nominal resolution according to the 0.5 FSC criterion. (A) FSC curves for complete particle sets from a single iteration of alignment. The number of particles in each set is listed in Table 1. (B) FSC curves for a fixed number of particles (40,620) used for each particle set. (C) FSC curves for complete particle sets after six iterations of orientation refinement. (D) FSC curves for a fixed number of particles after cross-validated alignment.

