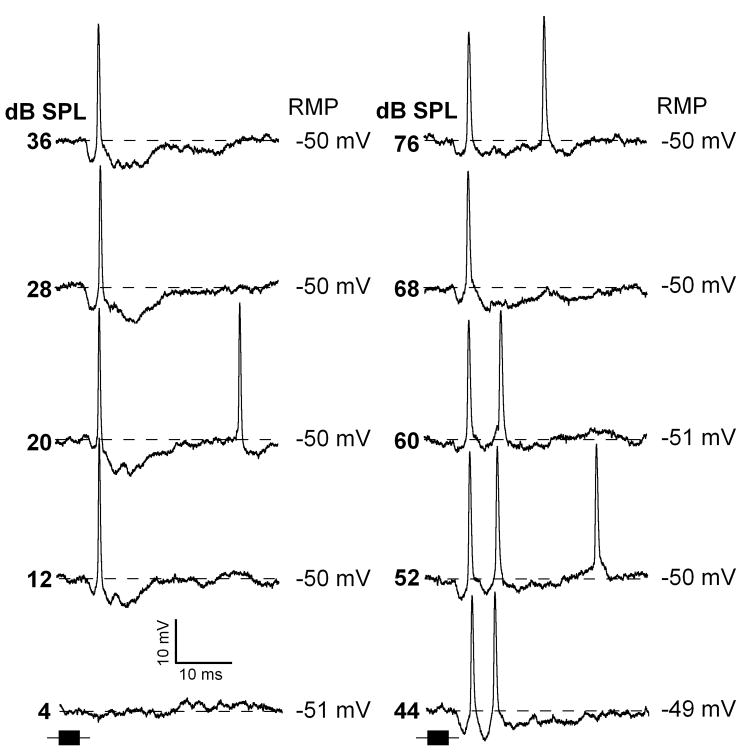
Figure 8.
Representative response traces of an IC neuron exhibiting sound evoked onset hyperpolarization with an action potential response at rising phase of the hyperpolarization (same neuron as in Fig.7C). Time course of the pure tones (52 kHz) are shown by black horizontal bars at the bottom of each column. Depth of recording = 1300 μm. For protocols, see Fig.1.

