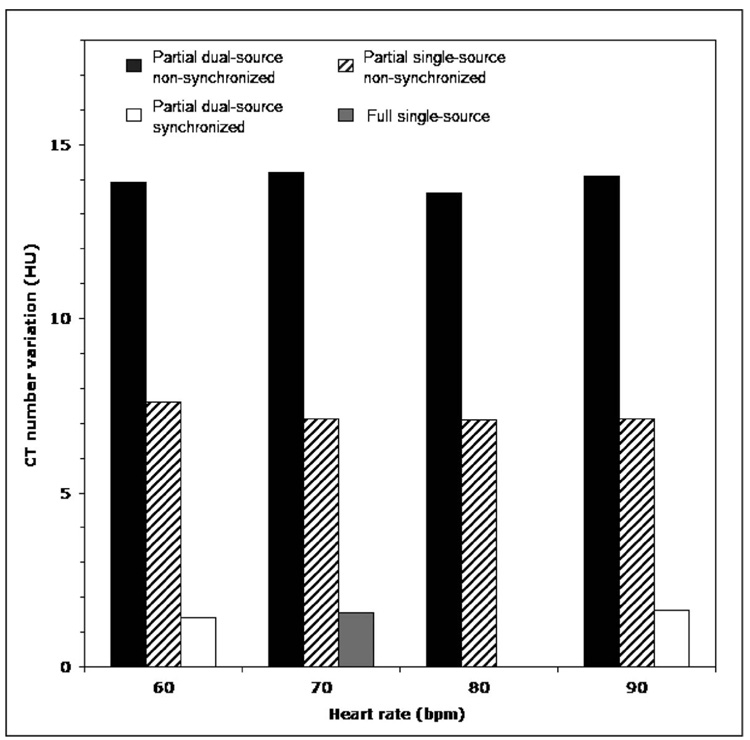
FIG. 8.
The maximum range of the image-to-image variations in a mean CT number for any evaluated ROI for synchronized and nonsynchronized partial scans of the cardiac phantom, as a function of the heart rate. The phantom was centered at the isocenter. The synchronized scans were performed for heart rate of 60.6 and 90.9 bpm.

