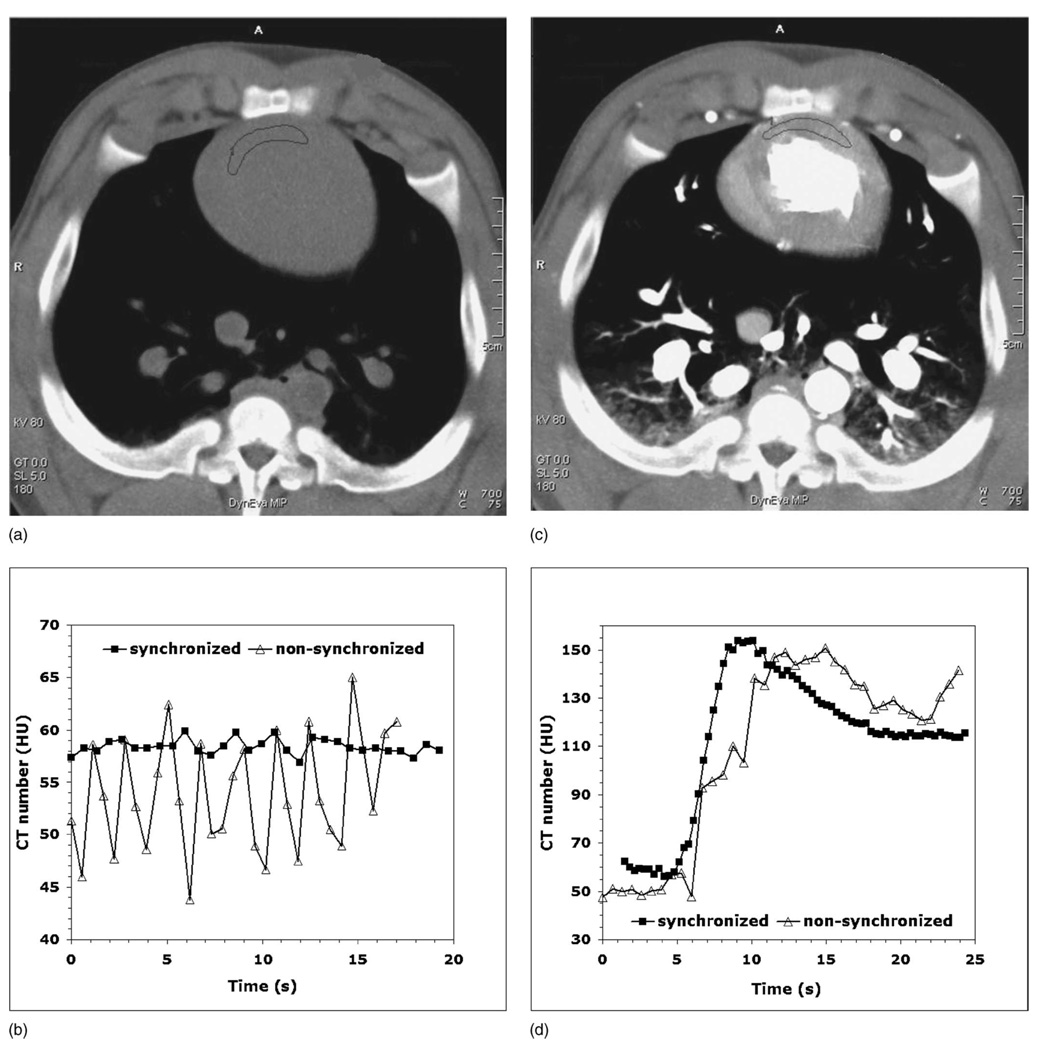
FIG. 9.
(a) Maximum intensity projection (MIP) image from the animal study in the absence of iodine contrast. (b) Noncontrast data show a drastic reduction in the CT number variations for the synchronized mode (square). (c) MIP image with the contrast enhancement of the myocardium (d) Myocardial perfusion data for the nonsynchronized mode (triangle) are degraded by partial scan artifacts.

