Figure 1.
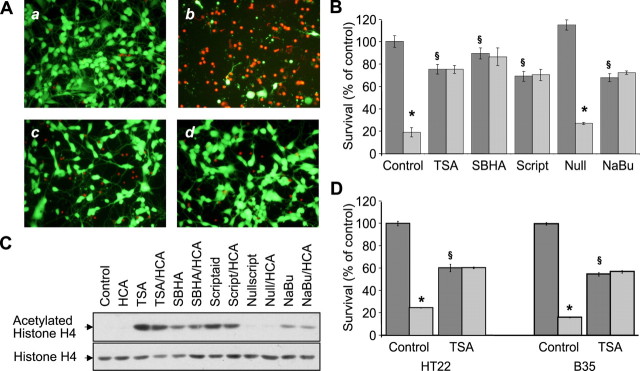
Structurally diverse HDAC inhibitors abrogate oxidative glutamate toxicity in embryonic cortical neuronal cultures and increase histone H4 acetylation. A, Representative micrographs showing live/dead staining of primary cortical neuronal cultures 24 h after treatment. a, nontreated control; b, 5 mm HCA; c, 0.66 μm TSA; d, HCA + TSA. Live cells are detected by uptake and trapping of calcein AM (green fluorescence). Dead cells fail to trap calcein but are freely permeable to the highly charged DNA-intercalating dye ethidium homodimer (red fluorescence). B, Graph showing primary cortical neuron viability, as determined using the MTT assay, after TSA (0.66 μm), SBHA (12.5 μm), scriptaid (6.13 μm), nullscript (6.13 μm), or sodium butyrate (1 mm) treatment in the presence (light gray) or absence (dark gray) of HCA (5 mm) for 24 h. Control is no HDAC inhibitor. C, Western blot analysis to detect relative levels of acetylated histone H4 and total histone H4 in acid-precipitated histone protein extracts from primary cortical neuronal cultures treated as in B. Antibodies against acetylated histone H4 or total histone H4 were used (see Materials and Methods). D, Graph showing cell viability in HT22 and B35, as determined using the MTT assay, after TSA (1.2 μm) treatment in the presence (light gray) or absence (dark gray) of HCA (5 mm) for 24 h. Control is no HDAC inhibitor. Graph bars in B and D depict mean ± SD. *Significant difference between non-HCA and HCA-treated groups, p < 0.0001, by two-way ANOVA. §Significant difference between non-HDAC inhibitor control and HDAC inhibitor alone-treated neurons, p < 0.05, by one-way ANOVA followed by Dunnett's multiple-comparisons test.

