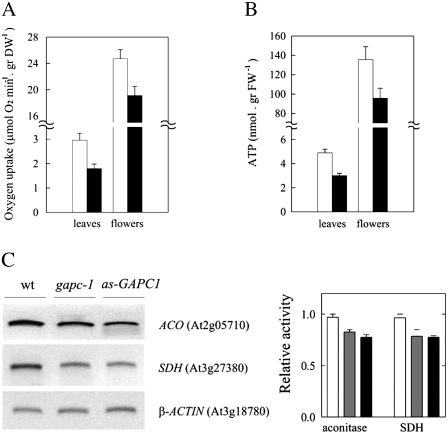
Figure 8.
Measurement of oxygen uptake, ATP levels, and analysis of the expression and activity of TCA cycle enzymes. A, Determination of O2 evolution (μmol O2 min−1 mg−1 dry weight) in detached leaves and flowers from wild-type (white bars) and gapc-1 plants (black bars). B, ATP levels determined in wild-type (white bars) and gapc-1 (black bars) Arabidopsis rosettes leaves and flowers. C, Left, RT-PCR analysis of ACO (At2g05710) and SDH (At3g27380) transcripts involved in TCA cycle determined in wild-type, gapc-1, and as-GAPC1 plants. Total RNA was reversed transcribed and then amplified using specific primers. The housekeeping β-ACTIN was used as internal control. C, Right, Enzymatic activity of aconitase and SDH in wild-type (with bars), gapc-1 (gray bars), and as-GAPC1 plants (black bars). Each enzymatic assay was performed using 10 μg total proteins from isolated mitochondrial fraction. The activity of each enzyme in wild-type plants was used as a reference value.

