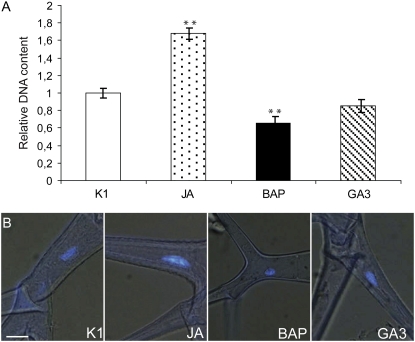
Figure 3.
Nuclear content of phytohormone-treated trichomes. A, DNA content of DAPI-stained nuclei in phytohormone-treated trichomes relative to that of mock-treated (K1) trichomes. Parameters to calculate the trichome DNA content are listed in Supplemental Table S2. Error bars represent se (n = 10). Statistical significance was determined by Student's t test (** P < 0.01). B, Microscopic analysis of the nuclear area of leaf 7 trichomes at 14 d after phytohormone treatment stained with DAPI. Bar = 10 μm.

