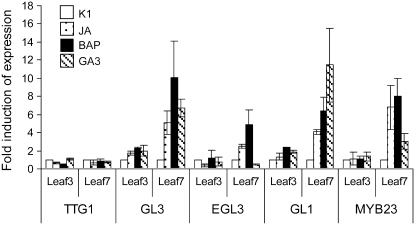
Figure 5.
Expression of trichome initiation genes in phytohormone-treated rosette leaves. Comparison of TTG1, GL3, EGL3, GL1, and MYB23 expression between the third and fourth leaves (pooled) and the seventh and eighth leaves (pooled) at 5 d after phytohormone treatment. Numbers on the ordinate give the fold induction compared with that in the mock treatment (K1). Error bars represent se (n = 9).

