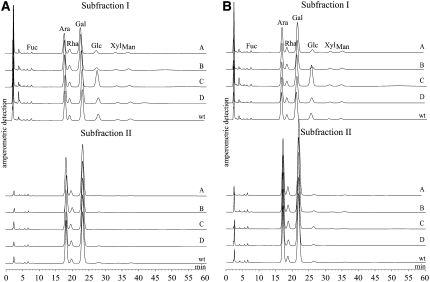
Figure 3.
Monosaccharide patterns from subfractions I and II from leaves of cPGM-overexpressing (lines A and B) or cPGM-underexpressing (lines C and D) potato lines. Leaves were harvested in the middle of the light (A) or the dark (B) period. As a control, wild-type leaves (wt) were harvested at the same time. Following acid hydrolysis, equal amounts of carbohydrates (4 μg of Glc equivalents) were analyzed by HPAEC-PAD. The monosaccharide patterns of subfractions I and II (representing the cytosolic and apoplastic heteroglycans, respectively, whose apparent sizes exceed 10 kD) are shown. For both panels, a typical chromatogram from three independently performed preparations (two independent batches of plants) is presented. All chromatograms were normalized to Ara.

