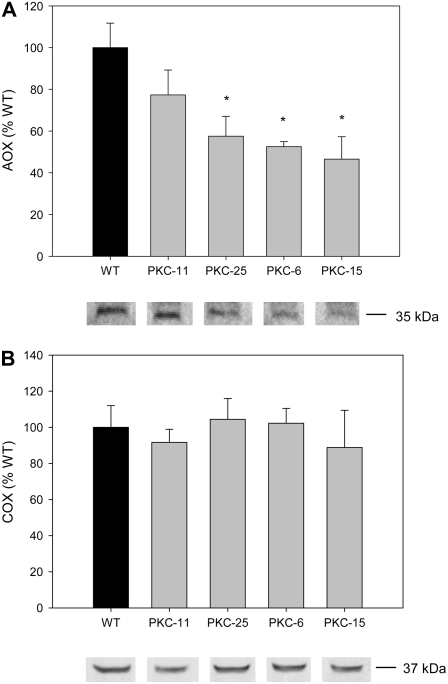
Figure 7.
Quantification of AOX and COX protein levels in wild-type and PKc transgenic tubers. Protein from isolated tuber mitochondria was electrophoresed under reducing conditions and western blots were probed with antibodies against AOX (A) or COX (B). The graphs show the mean protein levels obtained from quantification of the western blots (n = three tuber mitochondrial isolations per line, representing three independent tuber harvests. Representative western blot results are shown beneath graph bars (bands taken from the same western blot are shown for each antibody). Error bars represent ses. *, Significant difference from wild-type levels (P < 0.05).

