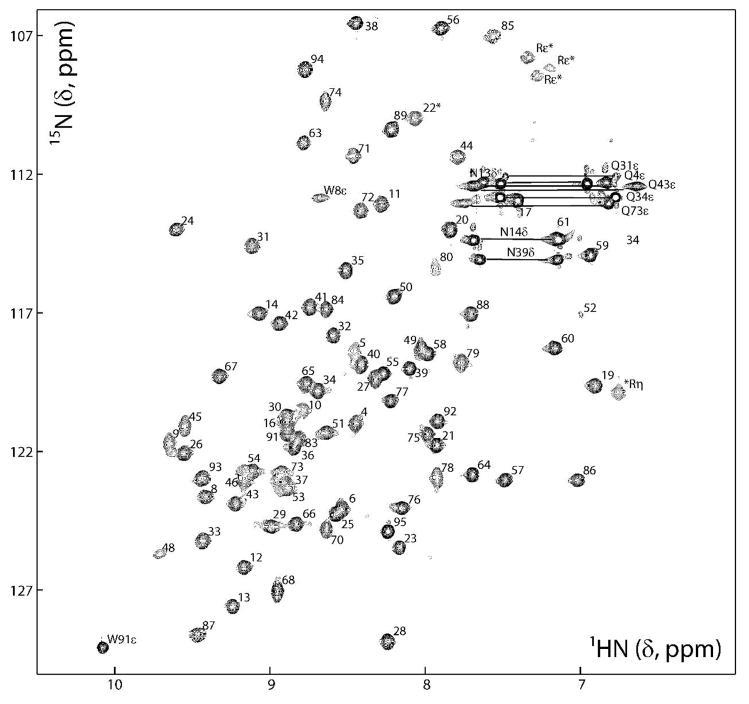
FIGURE 2.
2D 1H-15N HSQC spectrum of FBNYV M-Rep2-95 (0.6 mM in 20 mM sodium phosphate, pH 6.6, 0.6 M NaCl, 1 mM DTT, 8% D2O). Backbone amide resonances are labeled according to residue position in the protein sequence and the side chain NH2 signals are connected and labeled by residue type and number. Likewise, the side chain NH resonances of Trp and Arg residues are labeled by residue type and number, and position in the side chain. Folded signals in the 15N dimension are marked with asterisks.

