
Figure 5.
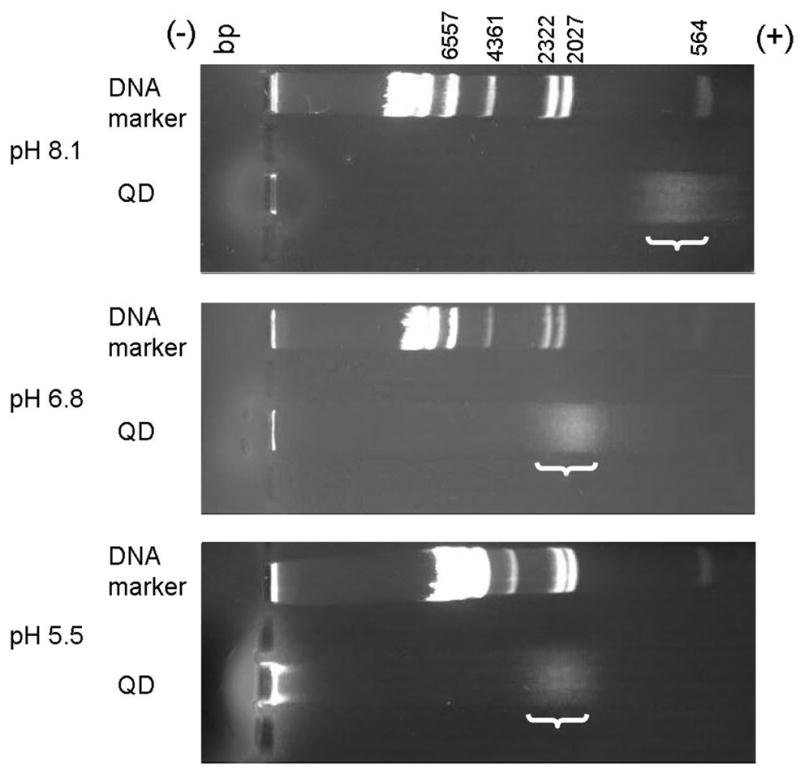
Gel electrophoresis of MAA-capped QDs and lambda DNA/Hind III markers at alkaline, neutral, and acid pH. DNA markers are references for comparing results in different gels. Negatively charged QDs migrate further from the cathode in higher pH. In alkaline conditions (10 mM TAE buffer, pH 8.1), the migration velocity of QDs is similar to that of DNA with ~600 bp (40 min). At neutral pH (10 mM MES buffer, pH 6.8), QDs migrate at approximately the rate of the ~2000 bp marker DNA (50 min). In acidic conditions (10 mM MES buffer, pH 5.5), QDs migrate with ~2400 bp DNA (50 min). The brackets indicate the position of the diffuse QD bands. The contrasts of the images are enhanced for better visibility.