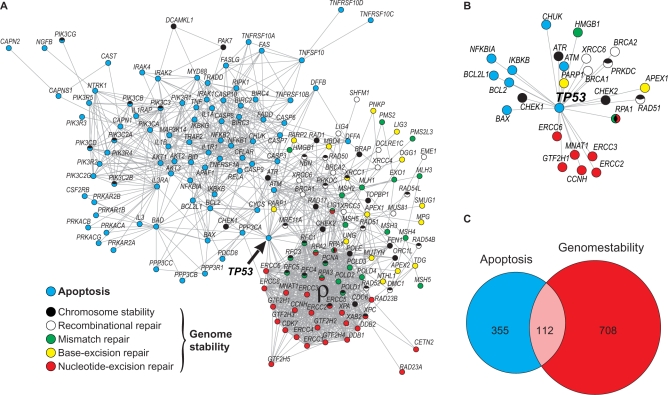
Figure 1.
Human apoptosis and genome-stability gene network. (A) Graph of interactions among genes involved in apoptosis and DNA repair pathways, as previously characterized in Castro et al. (19). Different pathways are represented in different colors. Network nodes with more than one color represent genes participating in more than one pathway. Gene IDs of each pathway are provided in Supplementary Table S1. (B) Magnification of TP53 gene position of in the network topology. It highlights the functional overlap of TP53, linking apoptosis to several genome-stability components. (C) Venn diagram showing the distribution of links between apoptosis and genome-stability pathways. The overlapped area corresponds to those links connecting both systems. The large number of associations among NER, MMR and chromosome-stability components is designed as ρ module.

