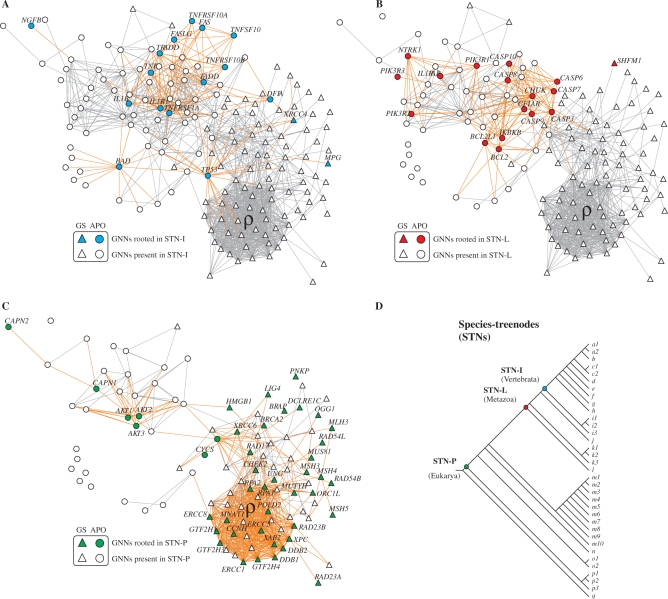
Figure 3.
From STNs to gene-network nodes (GNNs). Orthology projection of genes rooted in STN-I (A), STN-L (B) and STN-P(C). Roots of an ortholog: color nodes; presence of an ortholog: white nodes. The location of these three STNs in the species tree is indicated (D). In Supplementary Material Online we provide further examples of this orthology projection approach (Supplementary Figure S2) and compared with Inparanoid evolutionary scenarios as a different orthology data source (Supplementary Figures S3–S6).

