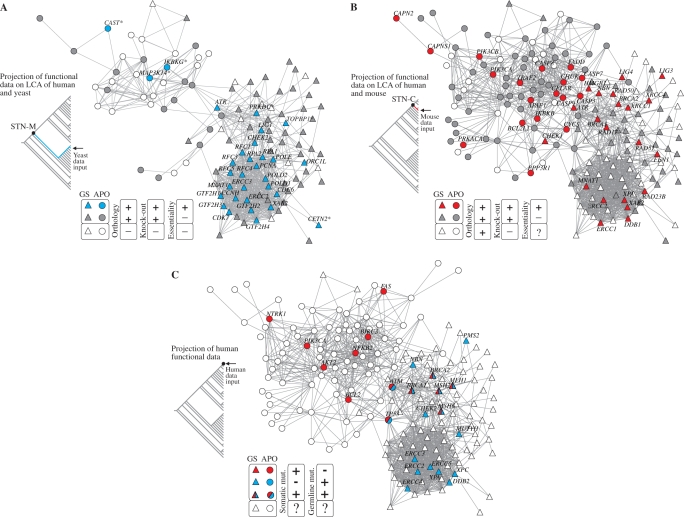
Figure 5.
Integrating evolutionary and functional data. (A) Projection of yeast lethality data onto human apoptosis and genome-stability gene network: essential (blue GNNs) and nonessential yeast orthologs (grey GNNs) according to SGD database (46). The graph presents all orthologs inferred in the LCA of yeast and human (i.e. rooted or present in STN-M). White GNNs correspond to genes present in the branch but absent in yeast, as predicted in the parsimony analysis (see ‘Materials and Methods’ section). Asterisks identify six GNNs whose orthology are predicted by orthologous groups but not confirmed in the Inparanoid database (47). (B) Projection of mouse lethality data onto human apoptosis and genome-stability gene network: essential (red GNNs) and nonessential (grey GNNs) mouse orthologs according to MGD database (45). The graph presents only GNNs whose orthologs are inferred in the LCA of mouse and human (i.e. rooted or present in STN-C). GNNs that lack knock-out data in MGD database are indicated as white GNNs (mainly in ρ module). (C) Projection of genes causally implicated in human cancer—CAN genes—according to Cancer Gene Census (48). Colors indicate whether the gene is somatically mutated in cancer (red GNNs) or mutated in germline predisposing to cancer (blue GNNs) or both. White GNNs indicate genes not mentioned in the Cancer Gene Census.

