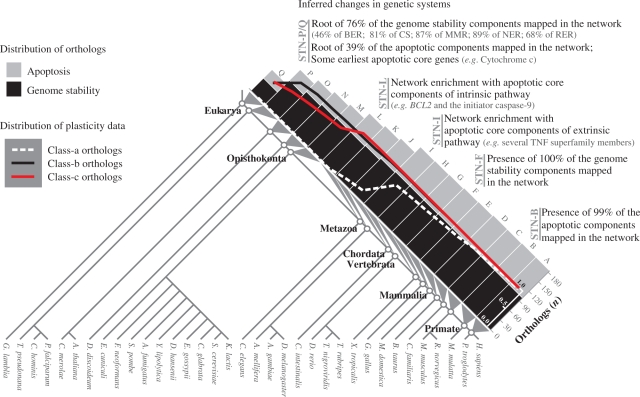
Figure 6.
Summary of the inferred changes in genetic systems. The histograms show the distribution of 180 human orthologs according to the roots inferred in the eukaryote species tree (for details, see Figures 2 and 3). STNs and the corresponding LCA are indicated. Inset graph shows the presence fraction of orthologs of each STNs (for details, see Figure 4D). Diverse important events related to the roots of sets of genes are pointed along the STNs. Chromosome stability (CS).

