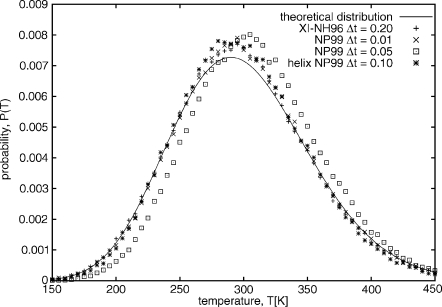
Figure 10.
Comparison of the temperature distribution obtained for the 20-residue polyglycine system obtained with XI-NH96 started from the extended structure with Δt=0.2 mtu (pluses), NP99 started from the extended structure with Δt=0.01 mtu (x’s), NP99 started from the extended structure with Δt=0.05 mtu (squares), and NP99 started from the equilibrated α-helical structure with Δt=0.1 mtu (stars), all run with RESPA (split=8). The theoretical distribution is of the form , and is plotted with a solid line.

