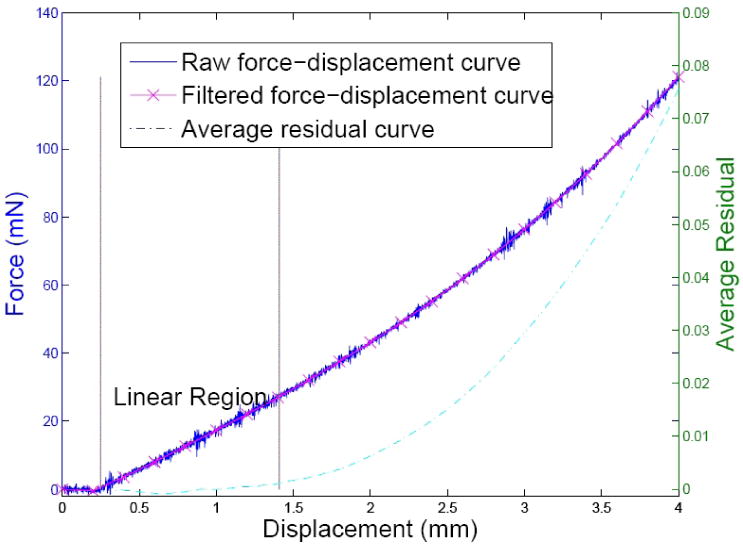
FIG. 2.

Indentation curve and determination of its linear region. The solid line is the raw indentation curve acquired by a tip of 2 mm in diameter. The ‘x’ marked line is the filtered indentation curve, whose ordinate is shown on the left. The dashed line shows the average residual curve and its ordinate is shown on the right. The abscissa is the displacement of the indenter tip. The linear region was determined to be between the point of surface contact and 0.001 in the average residual curve, which is shown between the two vertical lines.
