
FIG. 4.
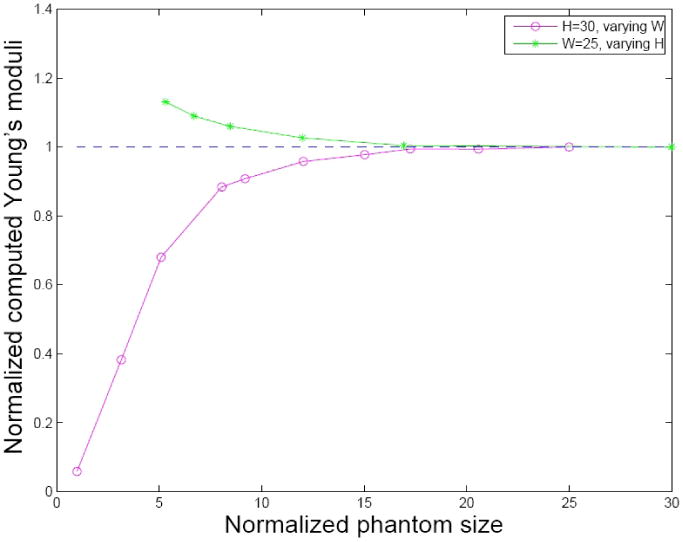
Impact of the sample sizes. Both the height and width were normalized by the tip radius. The circles represent reconstructed Young's moduli when keeping sample height constant (30 times the radius) and varying the sample width; the stars represent those keeping width constant (25 times the radius) and changing the sample height.