FIG. 5.
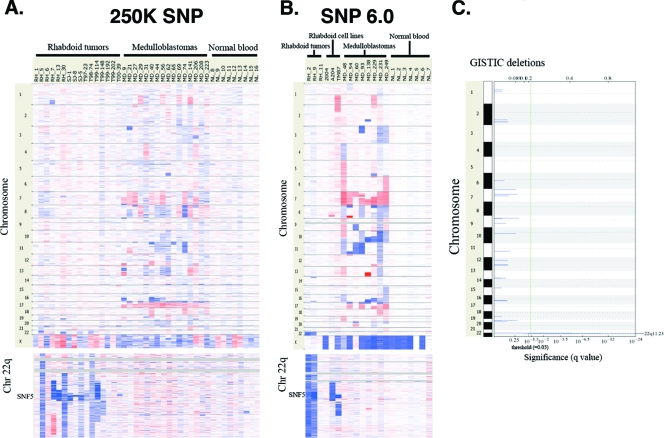
High-density SNP array analysis of SNF5-deficient MRTs. (A) DNA from 16 primary MRTs, 16 medulloblastomas, and 9 normal blood samples was analyzed on the Affymetrix 250K SNP array. A closeup view of the SNF5 locus on chromosome 22q11 is shown in the bottom panel. Red indicates regions of genomic amplifications, while blue indicates regions of genomic deletions. (B) DNA from an additional three primary MRTs, three MRT cell lines, eight medulloblastomas, and seven normal blood samples was analyzed on the Affymetrix 6.0 SNP array containing 940,000 SNPs. The SNF5 locus on chromosome 22q11 is shown in the bottom panel. (C) GISTIC was utilized to search for small deletions in the rhabdoid tumors. Deletion of SNF5 itself at 22q11 is the only significant finding (q < 10−24). Other changes are not significant and are of a magnitude consistent with normal copy number variation.

