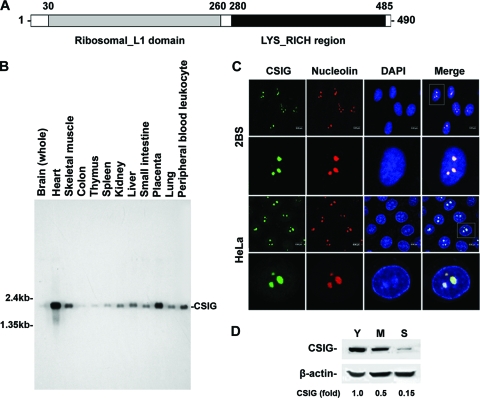
FIG. 1.
The tissue expression patterns, senescence-associated expression and subcellular localization of CSIG. (A) Schematic representation of human CSIG. (B) Multiple-tissue expression of CSIG. Results of Northern blot analysis using human multiple-tissue blot (Clontech). (C) Representative confocal images for indirect immunofluorescence of CSIG (green) in 2BS (top two rows) and HeLa (bottom two rows) cells. Cells were immunolabeled for endogenous CSIG with antisera against CSIG. Nucleoli (red) were immunolabeled with antinucleolin antibody, and nuclei (blue) were counterstained with DAPI. Right panels show merged confocal images. (D) Age-dependent decrease of CSIG. Results of Western blot analysis of expression of CSIG in young (Y; ∼28 pdl), middle-aged (M; ∼45 pdl), and senescent (S; ∼58 pdl) 2BS cells. β-Actin was served as a loading Ctrl. Relative abundances of CSIG were assessed by densitometry and are expressed as increases relative to the CSIG level in young 2BS cells.

