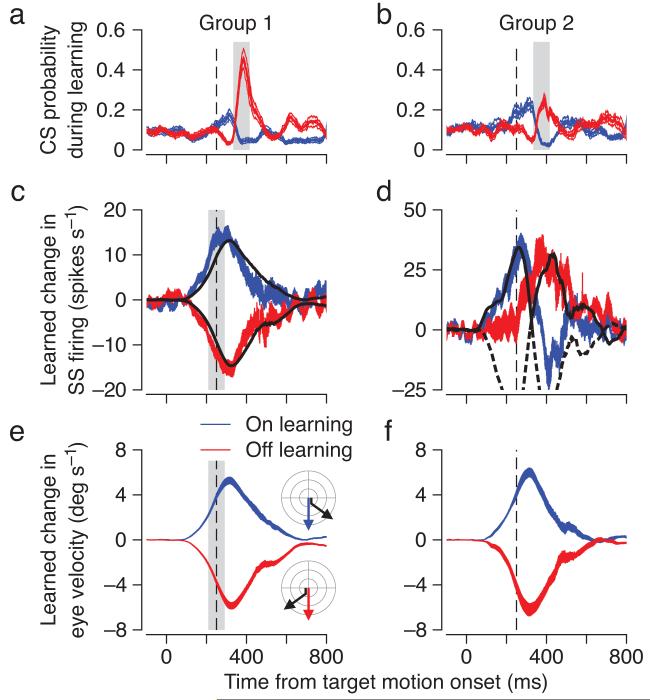
Figure 3.
Relationship between complex spike probability in learning trials and learned simple spike response in probe trials for group 1 and group 2 Purkinje cells. a, b: Probability of a complex spike during the first 50 learning trials in a learning block (measured in 100 ms bins). c, d: Learning-induced change in simple spike response, calculated as mean firing rate in probe trials after learning minus mean firing rate in pre-learning probe trials. In c, the black traces repeat the eye velocity averages from e. In d, the black traces show eye acceleration for the eye velocity traces in f, where the negative eye accelerations are shown as dashed traces. e, f: Learned eye movement, measured as the component of the eye velocity orthogonal to the direction of the target in probe trials. Blue and red traces indicate data for on-direction and off-direction learning, respectively. The ribbons show mean ±1 SEM. Vertical dashed lines show the time when the target changed direction in learning trials. Shaded areas show the analysis intervals for complex spike responses (a, b) and for simple spike responses and eye velocity (c, e). Data are averaged across 49 group 1 and 11 group 2 Purkinje cells.

