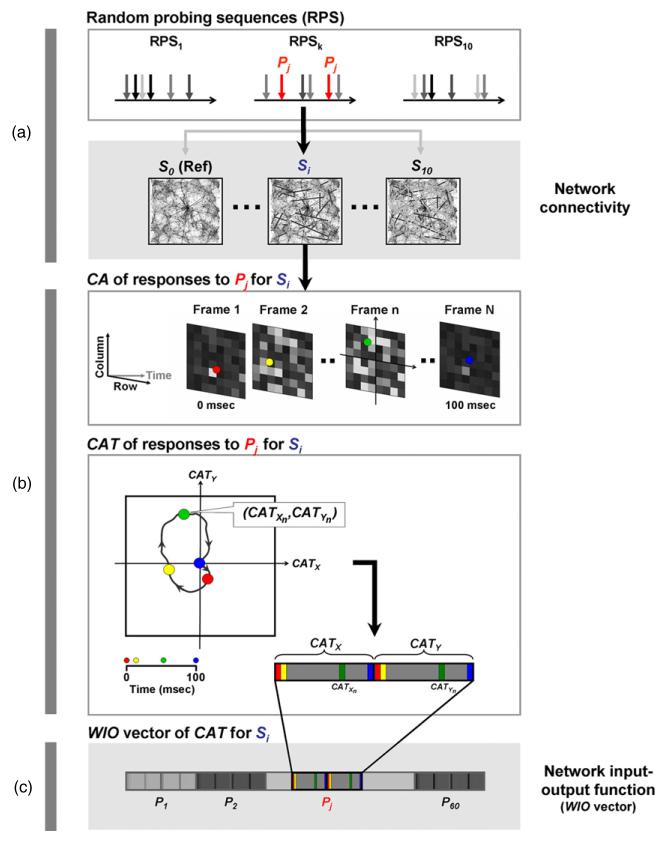
Figure 2.
Whole-input–output (WIO) vectors for analyzing performances of different statistics. WIO vectors calculated from each statistic were used to represent the network input–output function. As an example, the WIO vector of CAT calculated from probe responses to one RPS at one network state is demonstrated. (a) An RPS, RPSk, was delivered into a network with the synaptic state Si. (b) CA was calculated for evoked responses to the stimulation electrode Pj (j = 1 to 60). Each frame indicates the firing rate over a 5 ms moving time window (with a 500 μs time step) on an 8 by 8 grid of electrodes averaged over multiple stimuli at Pj (RPSk might have multiple stimuli delivered at Pj , see (a)). The 2D trajectory of CAs from frame 1 to frame N (from 0 to 100 ms after the stimuli), CAT, can be represented by a 1D vector by joining CATX and CATY. This vector represents CAT of responses to stimuli Pj at the network state Si. (c) CATs for responses to 60 different stimulation electrodes (P1 to P60) were joined together to form the WIO vector. This WIO vector represents the input–output function, in terms of CAT, of the network state Si. For each statistic, each synaptic state has one corresponding WIO vector to describe its input–output function. The statistic that is sensitive to changes in network synaptic states should be able to show significantly different WIO vectors from different synaptic states. One WIO vector was constructed for each RPS (RPSk, k = 1 to10) in each network state (Si, i = 0 to10). Therefore, for each statistic, 5050 WIO vectors were obtained (=(500 + 5) × 10. 505: 500 new networks + 5 reference networks, 10: number of RPSs delivered to each network).

