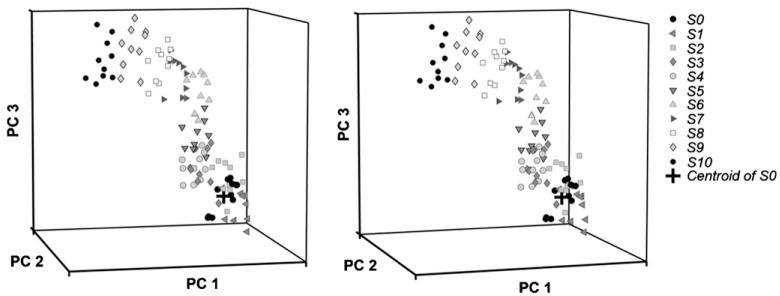
Figure 3.
Multi-dimensional whole-input–output (WIO) vectors measured in different synaptic states in simulated networks. The WIO vectors measured from different synaptic states were different. This is a cross-viewing 3D stereogram of an example of the WIO vectors for CATs from the simulations at S0 to S10 (generated by the same tetanization electrodes). Principal components analysis (PCA) was applied on the WIO vectors to visualize the data. Each symbol represents the first three principal components (PC1–PC3) of the WIO vector of a CAT from one simulation. Each synaptic state Si has ten corresponding symbols, which represent the results from ten different simulations (with different RPSs). The distance of each symbol from the centroid of S0 (shown as a cross) indicates the amount of change in CATs between the corresponding synaptic state and the reference state. CATs obtained from the synaptic states generated by longer tetanizations were further from CATs obtained from S0 than those from shorter tetanizations, indicating that longer tetani cause greater plasticity.

