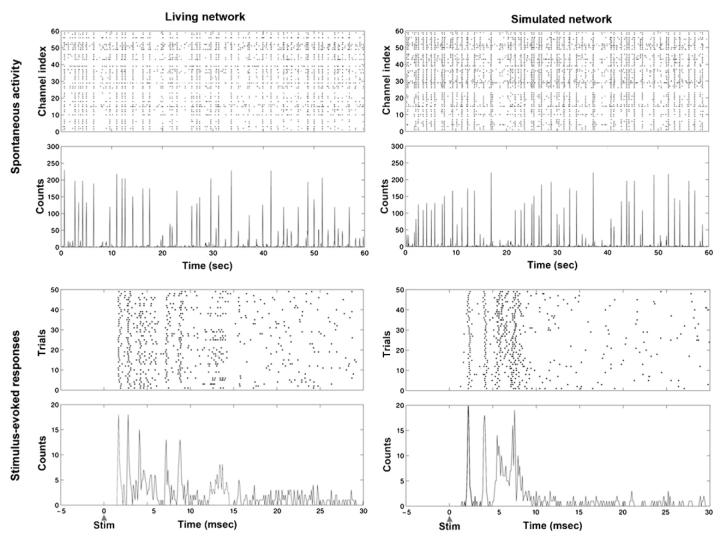
Figure 4.
Comparison of the network activities from a MEA culture and a simulated network. Simulated spontaneous activity and evoked responses resemble the experimentally recorded data. First row: 1 min of spontaneous activity was recorded from a living network by a 60 channel MEA and in simulation for comparison. The upper panels are spike raster plots. The lower panels are firing rate histograms, with bin sizes of 100 ms. Second row: 50 trials of evoked responses recorded by one electrode in a living network and in simulation are shown for comparison. The upper panels are spike raster plots. The lower panels are firing rate histograms with a bin size of 0.1 ms. The timings of stimuli for each trial were aligned at time zero. In the simulation, each electrode recorded the activities occurring within 100 μm.

