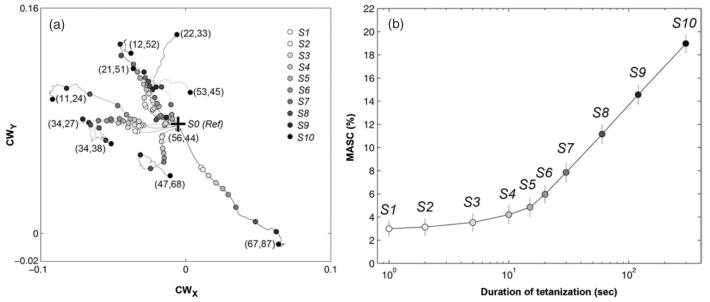
Figure 5.
Setup of different synaptic states in simulation. A series of networks with different synaptic states were obtained by tetanization at different electrode pairs and with different durations from the reference network. From each reference network S0, ten tetani at different electrode pairs were delivered. For each tetanization electrode pair, ten synaptic states were obtained after different durations. (a) Different tetanization electrode pairs caused different changes in synaptic weight distribution. The center of weights (CW) (see supplemental materials 7 available at stacks.iop.org/JNE/4/294) was used to visualize how the symmetry of the network synaptic weight distribution changed over time. Each curve represents CWs corresponding to a tetanization electrode pair (the column–row numbers of the electrodes are shown at the end of each curve). Synaptic states (S1 to S10) ‘collected’ at different tetanization durations and the corresponding reference state S0 are shown as dots. (b) The relation between mean absolute synaptic change (MASC) and the duration of tetanization (note log scale) from five reference networks. The means and the standard deviations of MASCs are shown (n = 50 networks: from five reference networks, each with ten different tetani).

