
Figure 6.
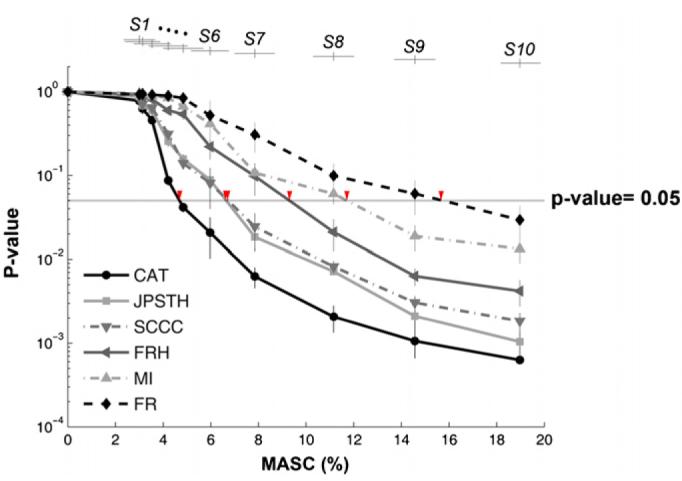
Evaluating the performances of different statistics. CAT showed the highest performance to detect changes in the synaptic state among six statistics. The performance of different statistics to detect changes in the synaptic state was evaluated by finding the ‘detectable MASC’ at the point the p-values reach a threshold of 0.05 (shown as arrows). For each state Si,50 p-values and 50 MASCs were collected from 50 networks (five reference networks with ten different tetanization electrode pairs per reference network, see results). The mean and standard deviation of the p-values (n = 50 networks) were plotted versus the corresponding MASC averaged across the networks (n 50 networks). The mean and standard deviation of MASCs (n = 50 networks) are shown on the top of the figure (with vertical offsets for clarity). The performance of the statistic to detect the difference in MASC shown in descending order is CAT, JPSTH, SCCC, FRH, MI and FR.