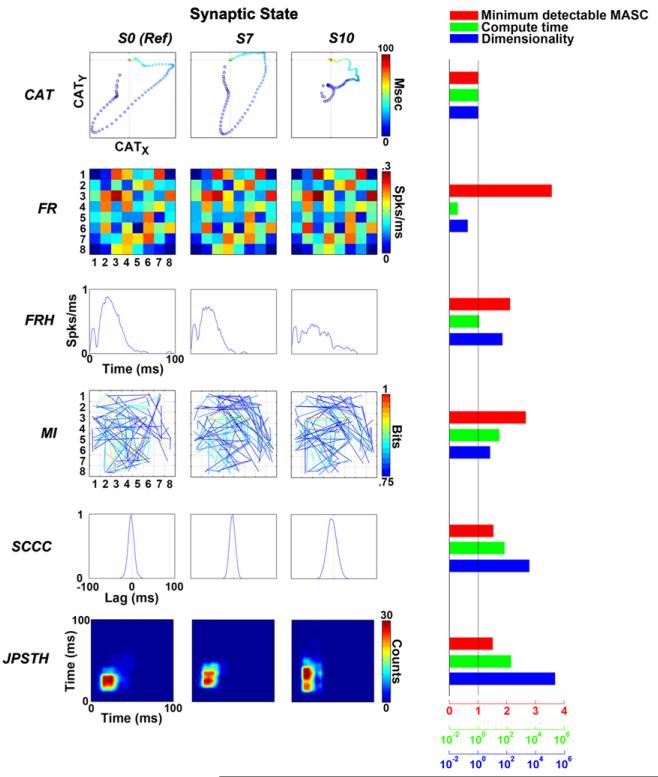
Figure 7.
Comparison of the six different statistics. CAT was the most sensitive activity statistic and was highly efficient. Examples of six statistics calculated from the same RPS during three synaptic states are shown: S0 (reference network), S7 (network with ∼50% of the maximal MASC, see figure 5(b)) and S10 (network with the maximal MASC). All statistics were obtained from the same randomly chosen stimulation electrode. CAT: CATs are plotted as CATX versus CATY from blue to red. FR: number of spikes per ms at each recording electrode is displayed according to the corresponding location in the 8 by 8 grids. FRH: FRHs, in the unit of number of spikes per ms, from a randomly chosen recording electrode are plotted. MI: MIs above 0.75 bits are plotted as colored lines between the corresponding electrode pairs. SCCC: SCCCs above zero from a randomly chosen pair of recording electrodes are plotted. JPSTH: JPSTH from the same randomly chosen pair of recording electrodes are shown. The performance (quantified by detectable MASC), compute time and dimensionality, normalized by the values for CAT, are shown on the right. The axes for detectable MASC, compute time and dimensionality are shown on the bottom in red, green and blue respectively (the latter two are with logarithmic scales). Among all six statistics, only FR and FRH had shorter compute time than CAT, and only FR had smaller dimensionality than CAT. However, CAT had significantly smaller detectable MASC than FR and FRH. CAT showed significantly higher performance to detect the difference in the network synaptic state than other statistics.

