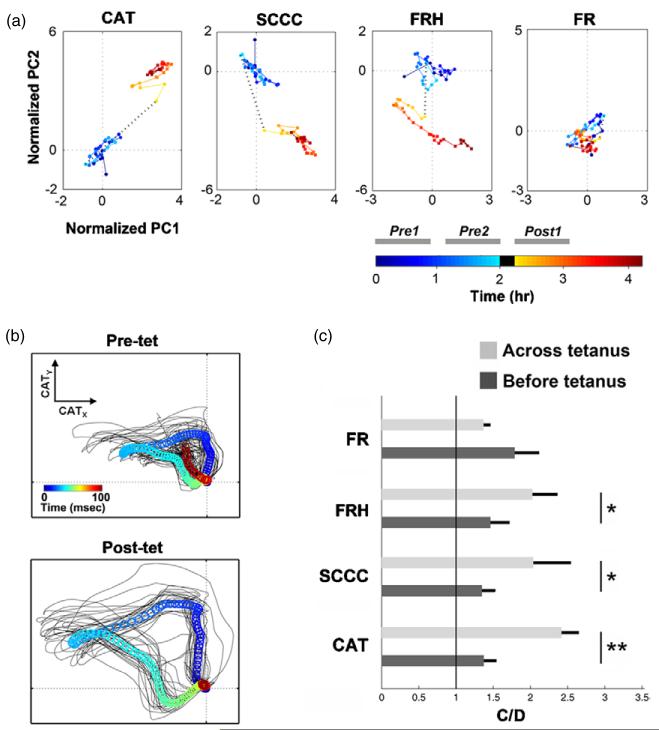
Figure 8.
Comparison of the changes in CAT, FR, FRH and SCCC across tetanization in living MEA cultures. (a) An example of comparison of CAT, FR, FRH and SCCC (from evoked responses to RPS in one experiment) before and after tetanization is shown. Principal components analysis (PCA) was applied on multi-dimensional WIO vectors for visualization purposes. The normalized principal component was obtained by removing its mean and then dividing through by its standard deviation. The normalized first principal component (PC1) was plotted versus the normalized second principal component (PC2). Each dot represents the statistic calculated from every block (a 240 s window), and the color indicates the corresponding time (shown in the colorbar). The black dashed line represents the tetanus. The separation between pre-tetanization clusters (bluish dots) and post-tetanization clusters (reddish dots) indicates the change of the statistic across the tetanus. (b) Different patterns of CATs were observed before and after tetanization. CATs from an example experiment were overlaid (black trajectories), and the average CATs were shown by series of circles (from blue to red across 100 ms probe response). The trajectories for every experiment can be found in the supplemental materials 6 (available at stacks.iop.org/JNE/4/294). (c) The statistics of C/D from six experiments showed that the change across the tetanus was significantly greater than the drift before the tetanus for CAT (**, p < 1 × 10⁻⁴, Wilcoxon signed rank test), FRH (*, p < 0.01) and SCCC (*, p < 0.01), but not for FR (p = 0.013). The p-values indicate that CAT was more capable of detecting the change over the drift than FRH, SCCC and FR.

