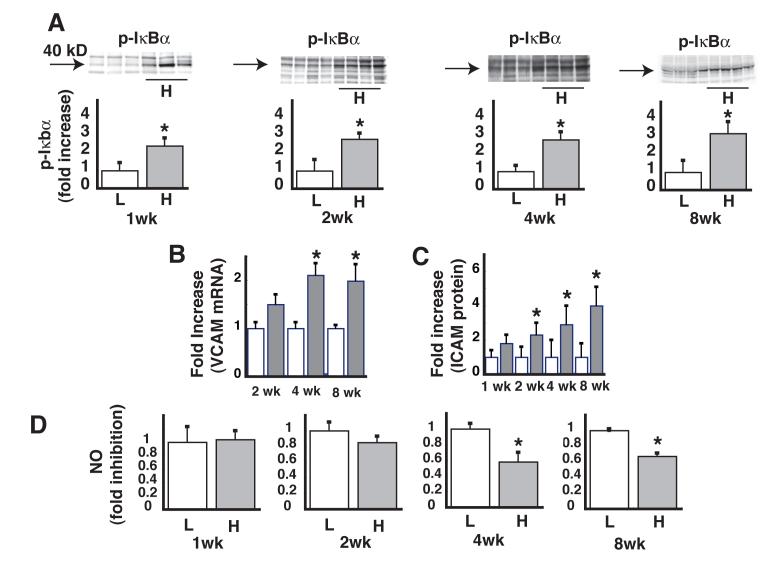
Figure 1. Time course of the effect HF feeding on vascular inflammation and basal NO levels.
A. Levels of phospho-IκBα in lysates of thoracic aorta after low fat (L) or high fat (H) feeding, with a representative Western blot for each time point. B. Fold increase in VCAM mRNA levels as measured by quantitative PCR. C. Fold increase in ICAM protein. D. Levels of NO in lysates of thoracic aorta. *P<0.05 vs. LF controls.

