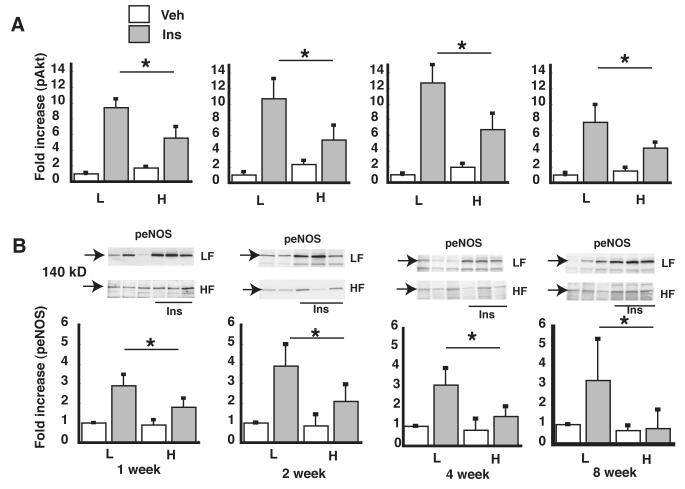
Figure 2. Time course of the effect of HF feeding on vascular insulin signaling.
A. pAkt levels in lysates of thoracic aorta as measured by ELISA. For each time point, pAkt levels were normalized to the low fat (L), saline vehicle condition. B. peNOS levels in lysates of thoracic aorta as measured by Western blot analysis, quantified using densitometry, and the ratio of peNOS/total eNOS was calculated. *P<0.05 vs. low fat controls (arrow indicates 140 kD molecular weight).

