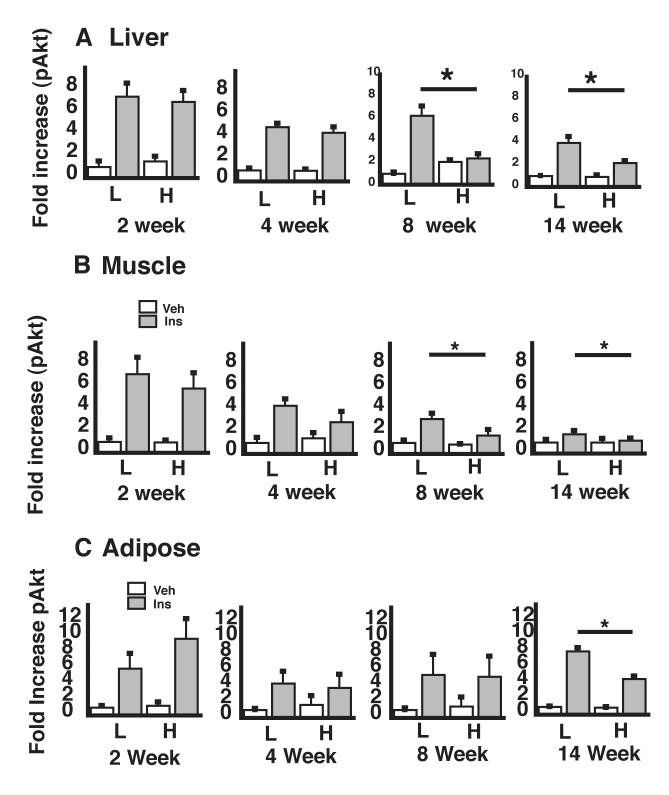
Figure 4. Time course of the effect of HF feeding on insulin signaling in liver, muscle, and adipose tissue.
After consuming a LF (L) or HF (H) diet for periods of 1-14 wk, mice received either saline or insulin. Fifteen minutes later, animals were sacrificed and tissues harvested for analysis of pAkt levels in lysates of liver (A), skeletal (quadriceps) muscle (B), and mesenteric adipose tissue (C). *P<0.05 vs. LF controls.

