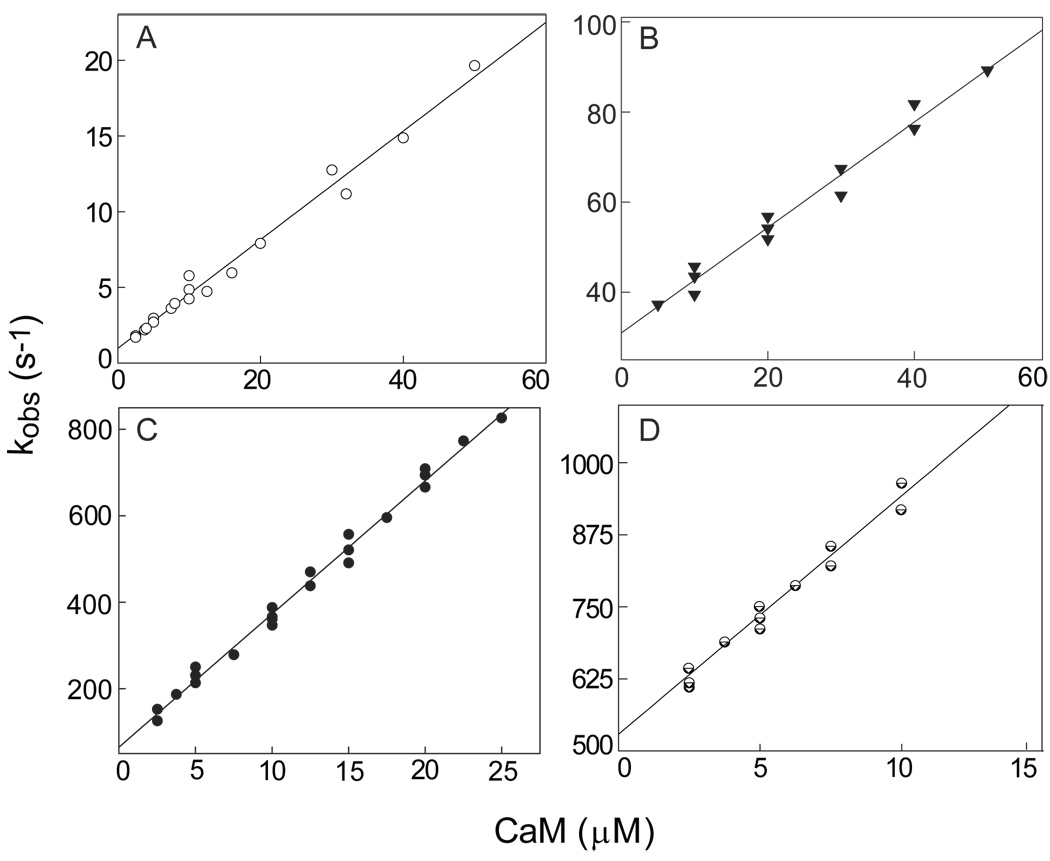
Fig. 1. Association of native and mutant CaMs with BSCaMIQ.
Values for kobs were derived from mono-exponential fits to time courses for BSCaMIQ fluorescence measured after addition of CaM. The lowest final CaM concentration produced was in all cases at least 5-fold greater than final BSCaMIQ concentration. Pseudo-first order conditions were thus maintained so that kobs = kon[CaM] + koff. (A) Replot of kobs values determined in the absence of Ca2+ vs the concentration of CaM. Nominally Ca2+-free conditions were produced by including 3 mM BAPTA in all experimental buffers. The kon and koff values derived from the linear fit shown are 3.6±0.2×10⁵ M−1-s−1 and 0.9±0.2 s−1. kon and koff values derived for Ca2+-free NxCCaM are 3.2±0.1×10⁵ M−1-s−1 and 1.1±0.1 s−1, and values of 2.9±0.1×10⁵ M−1-s−1 and 0.7±0.1 s−1 were derived for Ca2+-free NCxCaM (data not shown). (B) Replot of kobs values determined in the presence of 250 µM CaCl2 vs the concentration of NCxCaM. The kon and koff values derived from the linear fit shown are 1.1±0.2×10⁶ M−1-s−1 and 30.9±1.6 s−1. (C) Replot of kobs values determined in the presence of 250 µM CaCl2 vs the concentration of native CaM. The kon and koff values derived from the linear fit shown are 3.1±0.2×10⁷ M−1-s−1 and 69.4±9.6 s−1. (D) Replot of kobs values determined in the presence of 250 µM CaCl2 vs the NxCCaM concentration. kon and koff values of 4.1±0.2×10⁷ M−1-s−1 and 558.8±10.1 s−1 were derived from linear fit shown.

