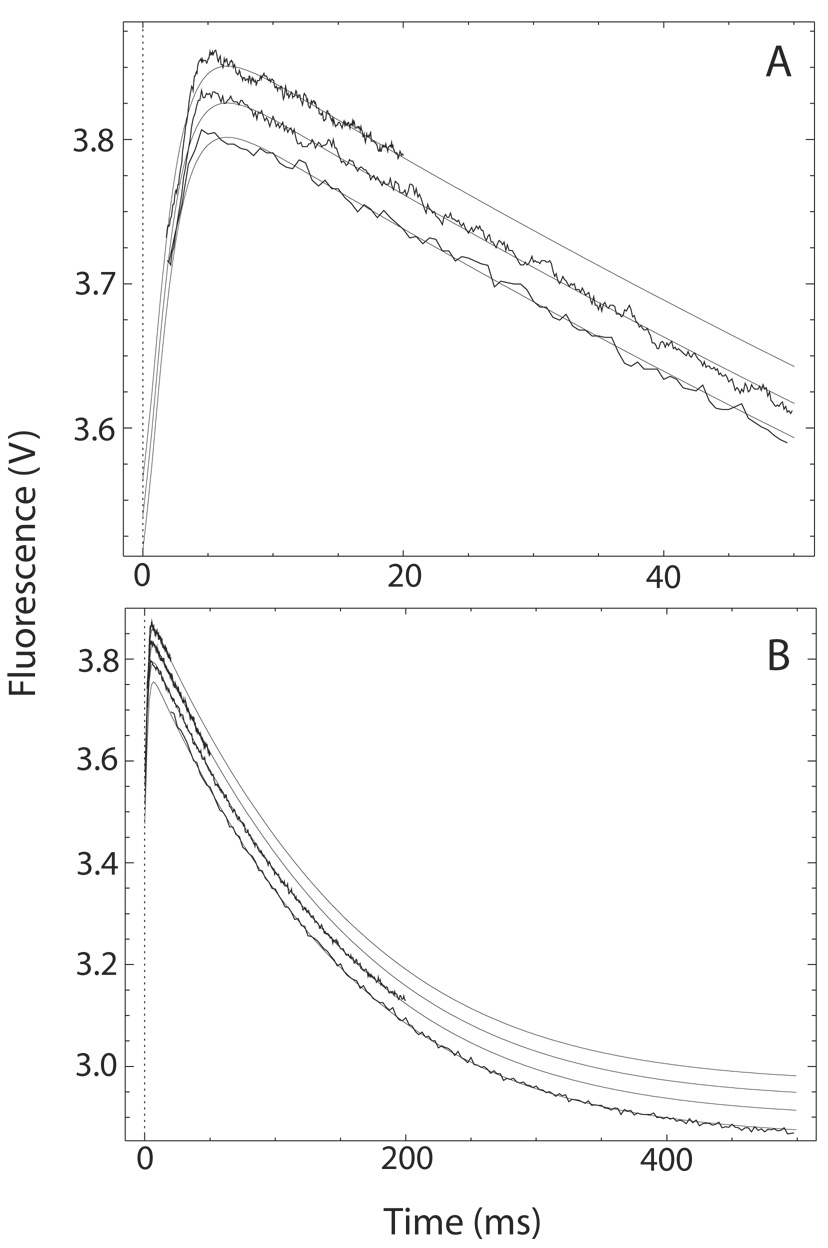
Fig. 4. The transition from Ca2+-saturated to Ca2+-free CaM-BSCaMIQ complex.
(A, B) Buffer containing 48 µM CaM and 4 µM BSCaMIQ in 500 µM CaCl2 was rapidly mixed with an equal volume of buffer containing 10 mM BAPTA. Data measured over 20, 50 and 200 ms time intervals are presented in panels A and B. Data measured over a 500 ms time interval are included in panel B. The individual data sets are offset on the y axis for presentation purposes. These data were globally fit to the model presented in Scheme 2 by iteratively varying the values for k′−2 and k′−4, the Ca2+ dissociation rate constants for bound CaM, using the DynaFit program (18). Relative molar fluorescence amplitudes were assigned to the various kinetic species as detailed under “Materials and Methods”. Association and dissociation rate constants applied to the various Ca2+-bound forms of the CaM-BSCaMIQ complex are given in Table 1. Ca2+ dissociation rate constants applied to free CaM are given in Table 2. Parameters assigned to the NC2-B species were determined using NxCCaM. No attempt was made to include the standard errors associated with fixed parameter values. Steps marked as fast were arbitrarily assigned rates 10-fold faster than the steps preceding them. The fitted values obtained for k′−4 and k′−2 are 528.3±3.3 and 13.5±0.1 s−1.

