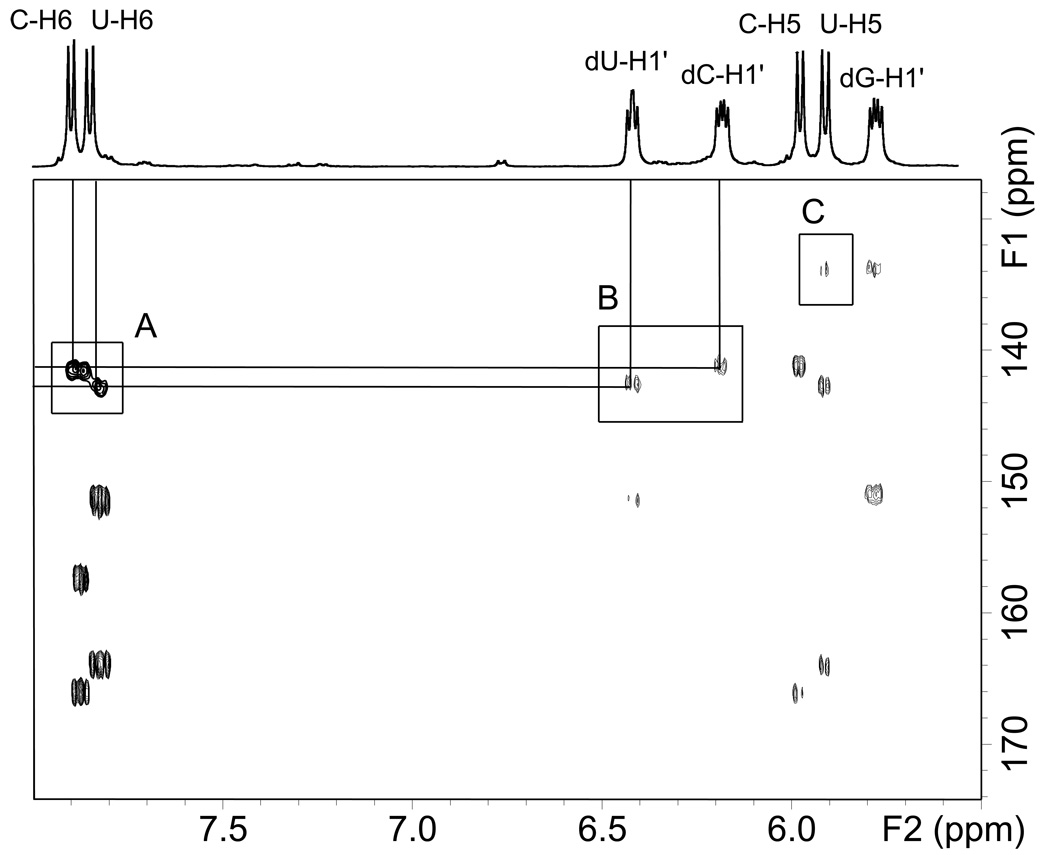
Fig. 6.
Superimposed portions of the HSQC and HMBC NMR spectra of 5’-d(G*pCpU*). The regions of the spectra shown represent correlations of the aromatic base / 2-deoxyribose H1’ protons and (1) their directly bonded carbons (HSQC) and (2) carbons separated by multiple bonds. The cross-peaks in the box marked A are HSQC correlations between C/U-H6 and their corresponding C/U-C6 atoms. The cross-peaks in the box marked B are HMBC correlations between dC/dU-H1’ and the C/U-C6 atoms. The box marked C shows a long-range 4-bond correlation from U-H5 to G-C8 (see the text).

