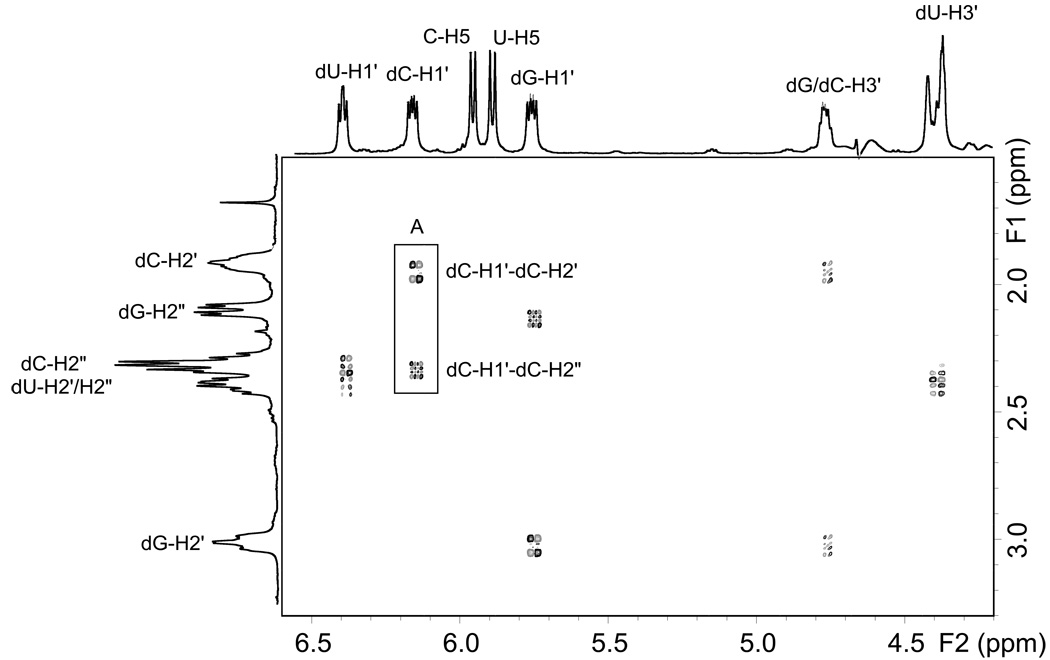
Fig. 7.
Portion of the phase sensitive DQF-COSY spectrum of 5’-d(G*pCpU*). The regions shown focus on the 2-deoxyribose scalar correlations between H1’ and H2’/H2” (5.5–6.5ppm) and H3’ and H2’/H2”(4.3–4.9ppm). The highlighted box shows the difference in correlation patterns between dC-H1’-H2’ and dC-H1’-H2”.

