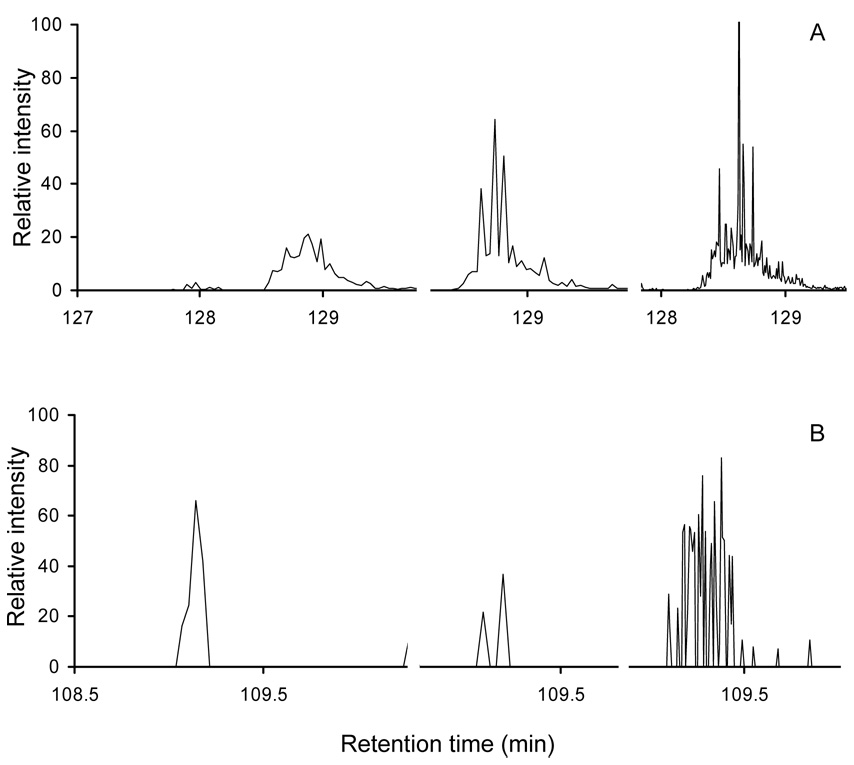
Figure 3.
Part A shows plots of extracted ion chromatograms for the peptide ion [GITWGEETLMEYLENPKK+2H]2+ obtained from triplicate runs with the left and center plots acquired in LC-MS/MS mode and the right plot acquired in LC-MS mode. Part B shows extracted ion chromatograms for [TSVNVVGDSFGAGIVYHLSK+2H]2+ obtained from triplicate runs with the left and center plots acquired in LC-MS/MS mode and the right plot acquired in LC-MS mode. We note that for both plots only a partial view of the ion chromatogram (with the peak of interest) is shown such that three peaks of the same ion can be displayed side by side within a single plot for better visual comparison.

