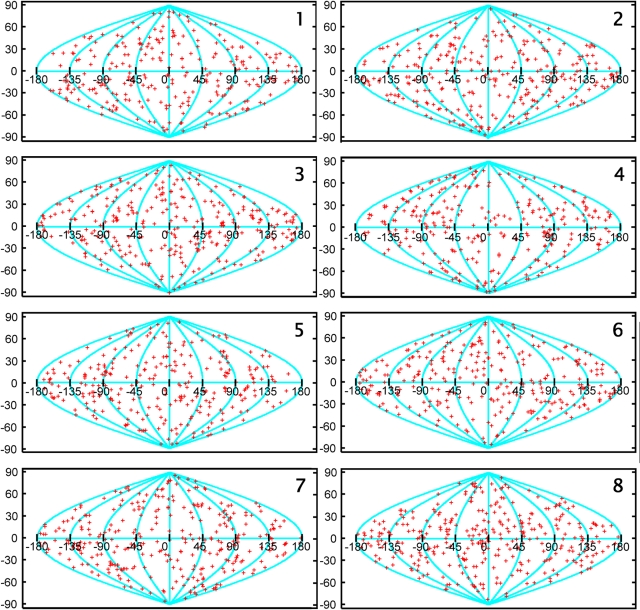
Figure 1. Spatial distribution of the HIV-1 Env spikes.
The selected (whole) HIV-1 spikes were aligned and sorted into eight classes. For each class, the tilt axis direction of each spike was calculated with respect to the spike coordinate frame and mapped onto the surface of a unit sphere (red “+” symbols), which was then converted to a two-dimensional representation with a sinusoidal projection. Latitude 90 degrees (vertical coordinate), for instance, corresponds to a tilt axis direction along the spike axis pointing to the spike head, −90 degrees to the spike base. The sinusoidal projection preserves the area, so that the density of the plotted points is the same as on the spherical surface. Numbers in the upper right corner of each panel correspond to the class numbers illustrated in Figure 3A.

