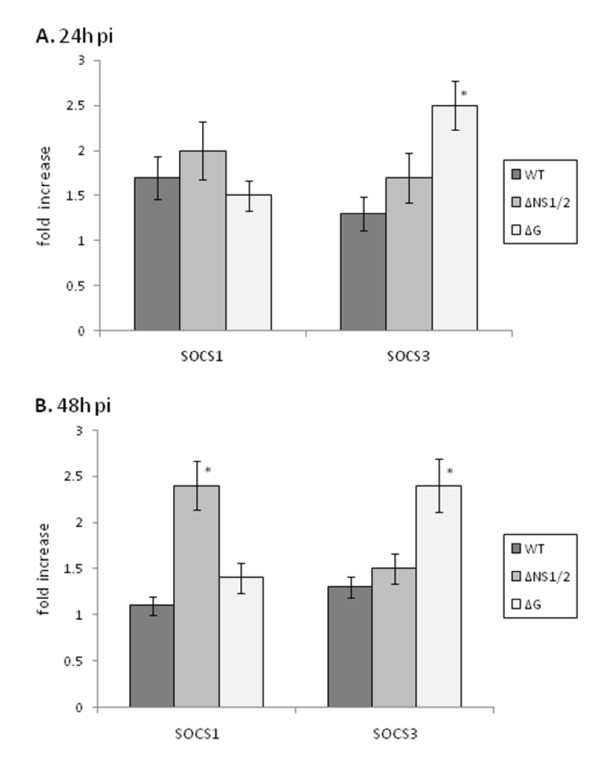
Figure 2.
RSV stimulation of SOCS1 and SOCS3 protein expression. RSV stimulation of SOCS1 and SOCS3 protein expression was determined in MLE-15 cells that were mock-infected or infected with WT, ΔG, or ΔNS1/2 virus at a multiplicity of infection (MOI) of 1 for 24 h (A) or 48 h (B). Cells were harvested at the times indicated and intracellular SOCS1 or SOCS3 levels determined by flow cytometry. Data is presented as fold-differences in protein expression relative to mock-infected cells. Differences in fold expression between virus infection groups were evaluated by Mann-Whitney U test and noted as significant as denoted by an asterisk. Data are shown as means ± standard errors (SE) of the means.

