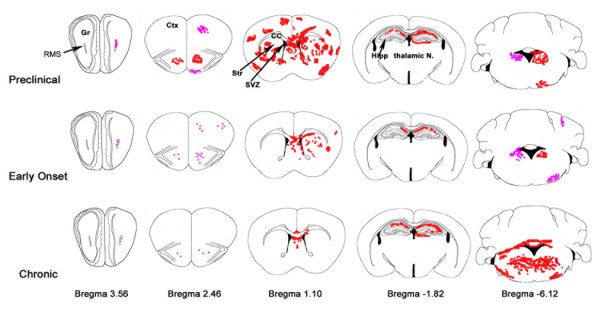
Figure 2.
Schematic of brain regions showing typical areas of CD45+ cell activation. Shown are qualitative averages of intensity and location of CD45+ cell activation. Pink represents levels 0–1 (low activation), and red, levels 2–3 (high activation). Note the preclinical group shows greater activation compared to early onset and chronic groups, except in the cerebellum where activation is greatest in the chronic group. Anterior – posterior distances are given as distances from bregma. Gr = granular layer of olfactory bulb, RMS = rostral migratory stream, Ctx = cerebral cortex, Str = striatum, SVZ = subventricular zone, CC = corpus callosum, Hipp = hippocampus. Modified from Paxinos and Franklin [33].

