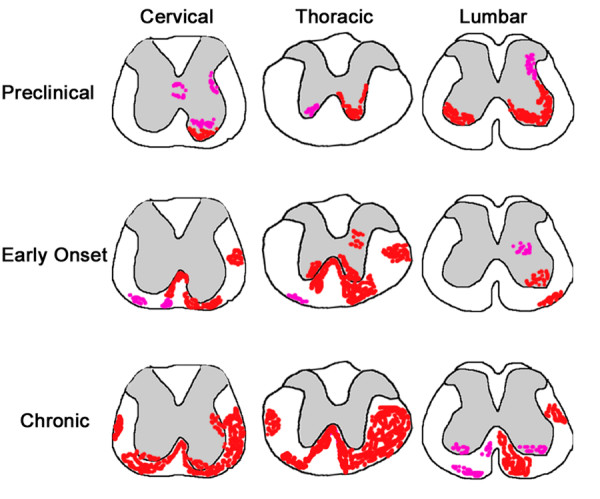
Figure 3.

Schematic showing areas of typical CD45+ cell activation in the spinal cord. Varying levels of activation are shown in preclinical, early onset, and chronic groups. Pink represents levels 0–1 and red, levels 2–3. Grey matter is indicated by grey shading. Spinal cord images are traces of actual early onset cervical, thoracic and lumbar spinal cord images.
