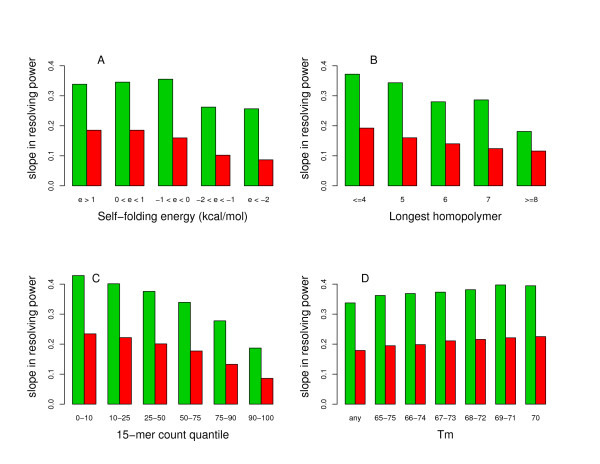
Figure 3.
Effects of varying some oligonucleotide constraints on resolving power. The negative (or absolute value) of the slope in the resolving power curve is shown for individual constraints on oligonucleotides when detecting one-copy deletions with 50-mer probes. The green (red) bars correspond to C. elegans (human) data. The individual oligonucleotide constraints that have been varied consist of (A) the self-folding energy, (B) the length of the longest homopolymer, (C) the 15-mer count, and (D) the melting temperature.

