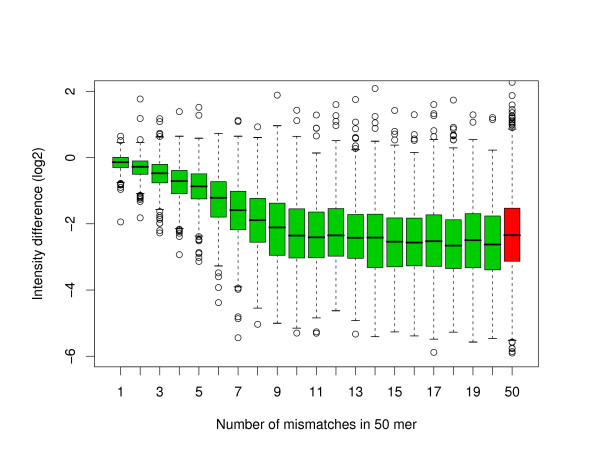
Figure 8.
Introduction of random mismatches in 50-mer oligonucleotides in C. elegans. Boxplots of the difference in fluorescence intensity in log2 scale between the original and perturbed 50-mer oligonucleotides. For the green boxplots, the perturbation consisted in the introduction of mismatches at random locations. The red boxplot is associated with a randomization over the full length of the oligonucleotide. In all the cases, the perturbed oligonucleotide has the same GC content as the original oligonucleotide in an attempt to keep the melting temperature constant.

