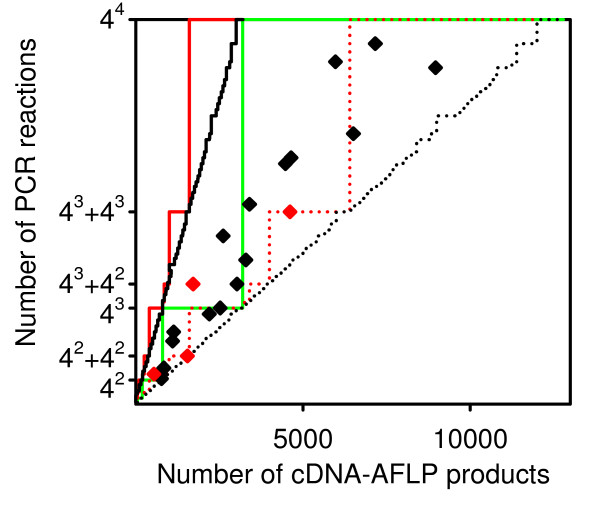
Figure 4.
Effect of partitioning fragments into mutually exclusive pools on the total number of PCRs. The lowest number of PCR reactions generating not more than 50 products per PCR on the average is plotted against the number of cDNA-AFLP fragments. PCR is performed either on all fragments in one pool (green line, the number of PCRs equals to the number of primer combinations) or on two (red lines) or six (black lines) mutually exclusive pools of fragments (PCRs are summed up over all pools). For two and six fragment pools (red and black lines, respectively), dotted lines depict the optimal partition of fragments (minimum number of PCRs) while full lines depict the least favorable partition of fragments (maximum number of PCRs). The results of simulations are shown as diamonds.

