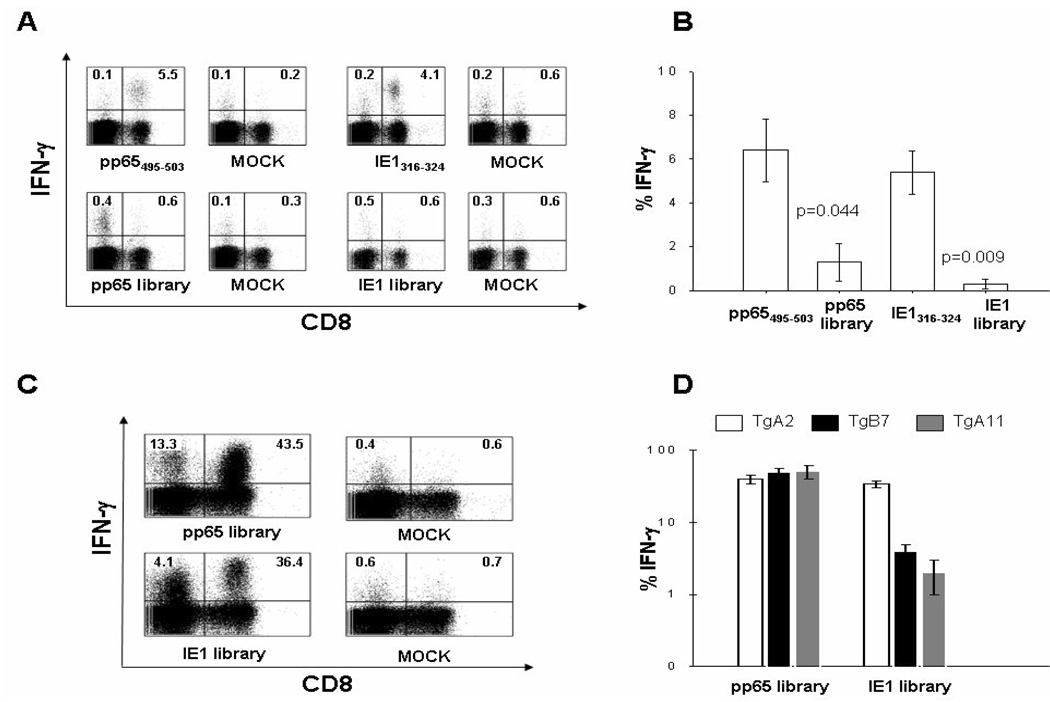
Figure 2. LPS lymphoblasts vs. LCL.
(A) IFN-γ production after syngeneic LPS lymphoblast IVS and ICS stimulation using the indicated CTL epitopes (upper plots) or peptide libraries (lower plots) in a representative A2 Tg mouse, immunized i.p. for 3 weeks with 50 M iu of an MVA construct expressing both pp65 and IE1 proteins. (B) Average levels of IFN-γ produced by CD8+ T-cells upon LPS lymphoblast IVS with either the epitope or peptide library as specified on the x axis, in five A2 Tg mice immunized as described in A. Difference significance between groups (p values) was tested by t test. (C) pp65 and IE1 specific IFN-γ production detected by ICS in a representative A2 Tg mouse immunized as in A. IVS was performed using pp65 or IE1 peptide library loaded HLA-A*0201 LCL. (D) Average levels of IFN-γ produced by CD8+ T-cells following Tg HLA-I matched LCL IVS and ICS stimulation with the peptide library specified on the×axis, in five A2 Tg (white histograms), five B7 Tg (black histograms) and five A11 Tg (grey histograms) mice, immunized as in A. The MOCK plots in A and C indicate that no epitope/library was used during the ICS stimulation. Numbers in the plots show percentages of CD8+ (upper right) or CD4+ (as CD8−, upper left) T-cells producing IFN-γ In B and D, IFN-γ production to mock stimulated cells during the ICS procedure was subtracted. Error bars represent the SEM among the immunized mice.

