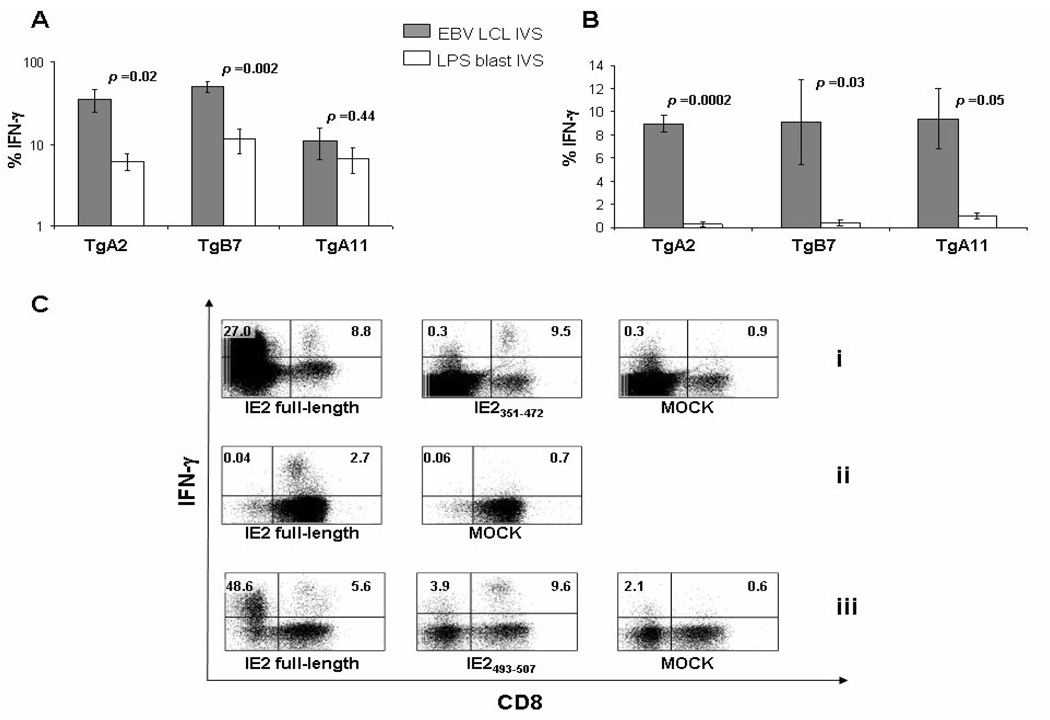
Figure 3. pp65/IE1-IE2fusion MVA immunogenic property.
(A–B) Average levels of IFN-γ produced by CD8+ T-cells following either Tg HLA-I matched LCL (grey bars) or syngeneic LPS lymphoblast (white bars) IVS in the Tg mice (5 mice/Tg strain) showed on the x axes, immunized i.p. for 3 weeks with 50 M iu of pp65/IE1-IE2fusion MVA. Error bars represent the SEM among the immunized mice. IFN-γ production to mock stimulated cells during the ICS procedure was subtracted. Difference significance between groups (p values) was tested by t test. In A, the following HLA-I restricted CTL peptide epitopes were used for the cell stimulation: pp65495–503[13] for A2 Tg, pp65265–275[28] for B7 Tg, pp6513–24[28] for A11 Tg mice. In B, the stimulation was performed with the IE2 peptide library for all Tg mice. (C) IFN-γ production in representative Tg mice (i and ii, A2 Tg; iii, B7 Tg) immunized and stimulated as described in B. In ii, a CD8+ enriched cell population (see Materials and Methods) was used during the IVS. The peptide library, sub-library or sequence used during the ICS stimulation is reported under each plot. MOCK plots show IFN-γ backgrounds (no epitope/library was used during the ICS stimulation). Numbers in the plots indicate the percentages of CD8+ (upper right) or CD4+ (as CD8−, upper left) T-cells producing IFN-γ.

