
Figure 2.
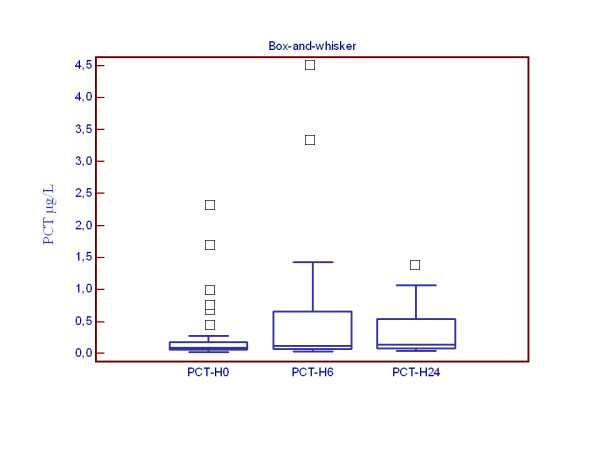
Box-and-whisker plots representing PCT levels measured at various time. On the horizontal axis, and for each boxplot, the legend corresponds to the time of PCT measurement. On the vertical axis, the number corresponds to the PCT levels (μg/L). Each box denotes the middle 50% of the data measured at that time. The lower and upper ends of the box denote the 25th and 75th percentile, respectively. The solid black horizontal lines through each box denote the median of the distribution. The vertical solid black lines (the "whisker") reach out to the 1.5 interquartile range. Circles above the whisker denote individual external observations.