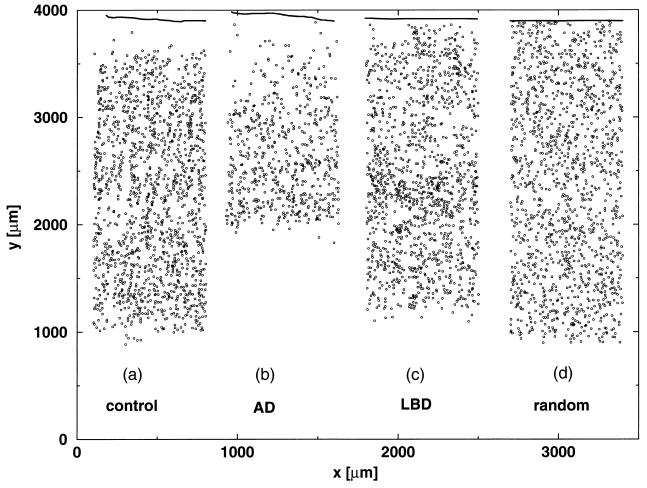
Figure 1.
(a) Typical example of distribution of neurons in a tissue sample of a normal STS cortex. We count neurons (dots) in 50-μm-thick STS cortex slices of a length l parallel to the pial surface (solid line) by the depth of the cortex h; l varies from 700 to 2,000 μm. The depth of cortex h is 3.0 mm. (b) Same as a, but for Alzheimer disease cortex. The depth of cortex h is 2.5 mm. (c) Same as a, but for cortex of dementia with Lewy bodies. The depth of cortex h is 3.1 mm. (d) Same as a, but for a random placement of the same number of dots as illustrated in a.

